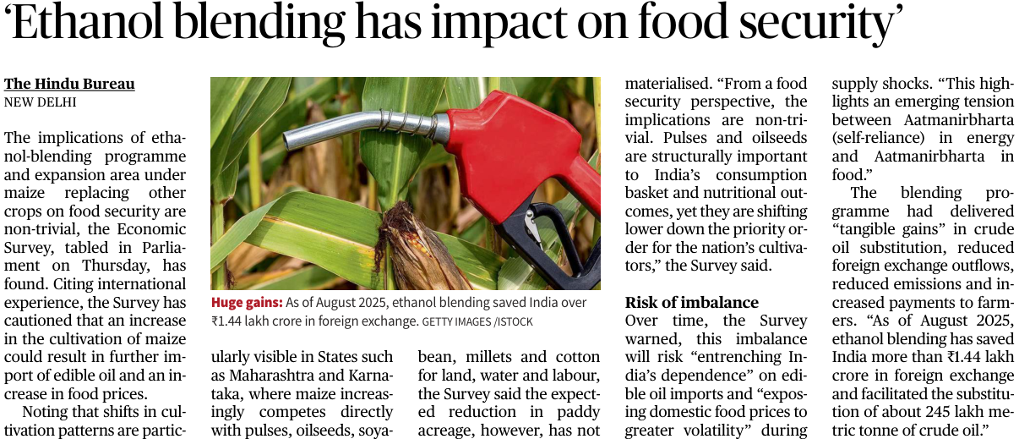
The Economic Survey, tabled in Parliament, has flagged that the expansion of ethanol blending—especially through increased maize cultivation—has non-trivial implications for food security, crop balance, and price stability, even as it delivers energy and forex gains.
Objective: Reduce crude oil imports, enhance energy security, and cut emissions through ethanol blending with petrol.
Feedstock shift: Growing reliance on maize alongside sugar-based ethanol.
Maize expansion is replacing pulses, oilseeds, soyabean, millets, and cotton in some regions.
This competition for land, water, and labour is pronounced in States like Maharashtra and Karnataka.
Pulses and oilseeds are critical for nutrition and consumption baskets, yet are losing priority in cultivation.
Increased maize acreage may raise edible oil imports and push up food prices.
The expected reduction in paddy area has not materialised, limiting compensatory effects.
Over time, the imbalance could entrench dependence on edible oil imports.
Domestic food prices may face greater volatility during supply shocks.
Highlights tension between Atmanirbharta in energy and Atmanirbharta in food.
Ethanol blending has delivered tangible benefits: reduced crude oil substitution, lower forex outflows, and higher payments to farmers.
The programme has contributed to emissions reduction and diversification of energy sources.
Forex savings: As of August 2025, ethanol blending saved India over ₹1.44 lakh crore in foreign exchange.
Crude substitution: Enabled substitution of about 245 lakh metric tonnes of crude oil.
Caution: International experience suggests unchecked maize expansion can increase food imports and prices.
Q. Consider the following statements regarding ethanol blending in India:
1.Expansion of maize cultivation for ethanol can intensify competition with pulses and oilseeds for land and water.
2.Ethanol blending has unambiguously reduced India’s dependence on edible oil imports.
Statement 1 is correct as maize expansion competes with nutritionally important crops.
Statement 2 is incorrect because the Economic Survey warns of a potential increase in edible oil imports, not a clear reduction.
The Economic Survey 2025–26 highlights the need for India’s financial sector regulators to balance openness to global capital flows with safeguarding the domestic economy from external shocks, amid heightened global uncertainty.
Regulators must balance growth with stability, ensuring openness to capital flows while insulating the economy from volatility.
Emphasis on context-specific regulation rather than a one-size-fits-all approach.
Shorter regulatory leash for emerging or fragile market segments prone to excessive risk-taking.
Greater regulatory latitude for mature and stable markets to support innovation and depth.
India’s monetary and financial sectors showed robust performance in FY26 (April–December 2025).
Strengthened by strategic policy actions and enhanced structural resilience across financial intermediation.
Gross NPAs of Scheduled Commercial Banks declined to 2.2% (September 2025).
Net NPAs fell to 0.5%, both at multi-decade lows, reflecting improved asset quality.
Outstanding credit growth rose to 14.5% year-on-year by December 2025.
Demat accounts crossed 21.6 crore by December 2025.
Unique investors crossed 12 crore in September 2025, with nearly 25% women investors.
Mutual fund investor base expanded significantly, including strong participation from non-metro areas, indicating deeper financial inclusion.
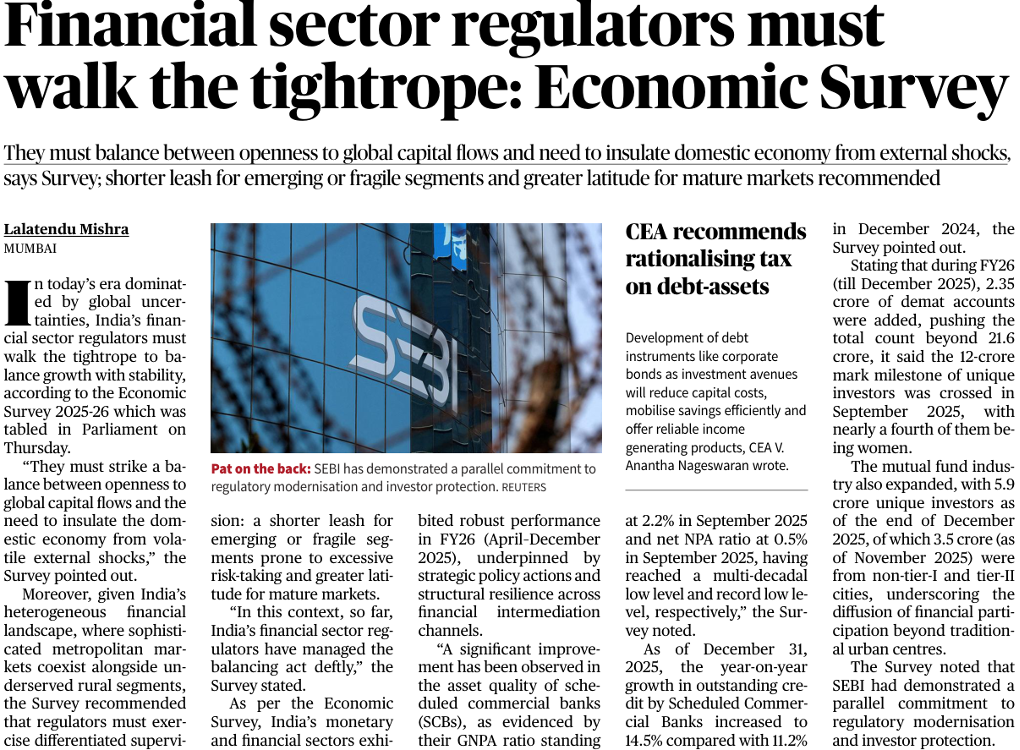
Regulators have balanced regulatory modernisation with investor protection.
The Survey notes SEBI’s parallel focus on market development and safeguarding investors.
Q. Consider the following statements regarding the recommendations of the Economic Survey on financial sector regulation:
1.The Survey advocates differentiated regulation with stricter oversight for fragile market segments.
2.It recommends complete insulation of India’s financial markets from global capital flows.
Statement 1 is correct as the Survey supports a differentiated, risk-based regulatory approach.
Statement 2 is incorrect because the Survey stresses balancing openness to global capital with protection from shocks, not complete insulation.
Economic Survey predicts bright India, increasingly darker worldGS 3: Indian Economy – Growth, Macroeconomic Stability, Global Economy
ContextThe Economic Survey 2025–26, tabled in Parliament, projects a strong medium-term growth outlook for India while warning of rising global economic risks and heightened uncertainty in 2026.
Key Points
India’s Growth Outlook
Medium-term growth forecast raised to 7% from the earlier estimate of 6.5%.
FY27 growth projected at 6.8%–7.2%, reflecting resilience of the domestic economy.
For FY26, government growth estimate stands at 7.4%; Q3 (Oct–Dec 2025) growth forecast at 7%.
Drivers of India’s Growth
Capital formation and improved labour participation.
Higher efficiency in deployment of factors of production.
Reform momentum in recent years strengthened medium-term growth capacity.
Role of Structural Reforms
Manufacturing-oriented initiatives, including production-linked incentive schemes.
FDI liberalisation and logistics reforms supporting capacity creation.
Sustained public investment in physical and digital infrastructure.
Tax simplification and targeted measures for MSMEs easing credit constraints.
Stronger corporate and financial sector balance sheets and rising formalisation of employment.
Global Economic Outlook
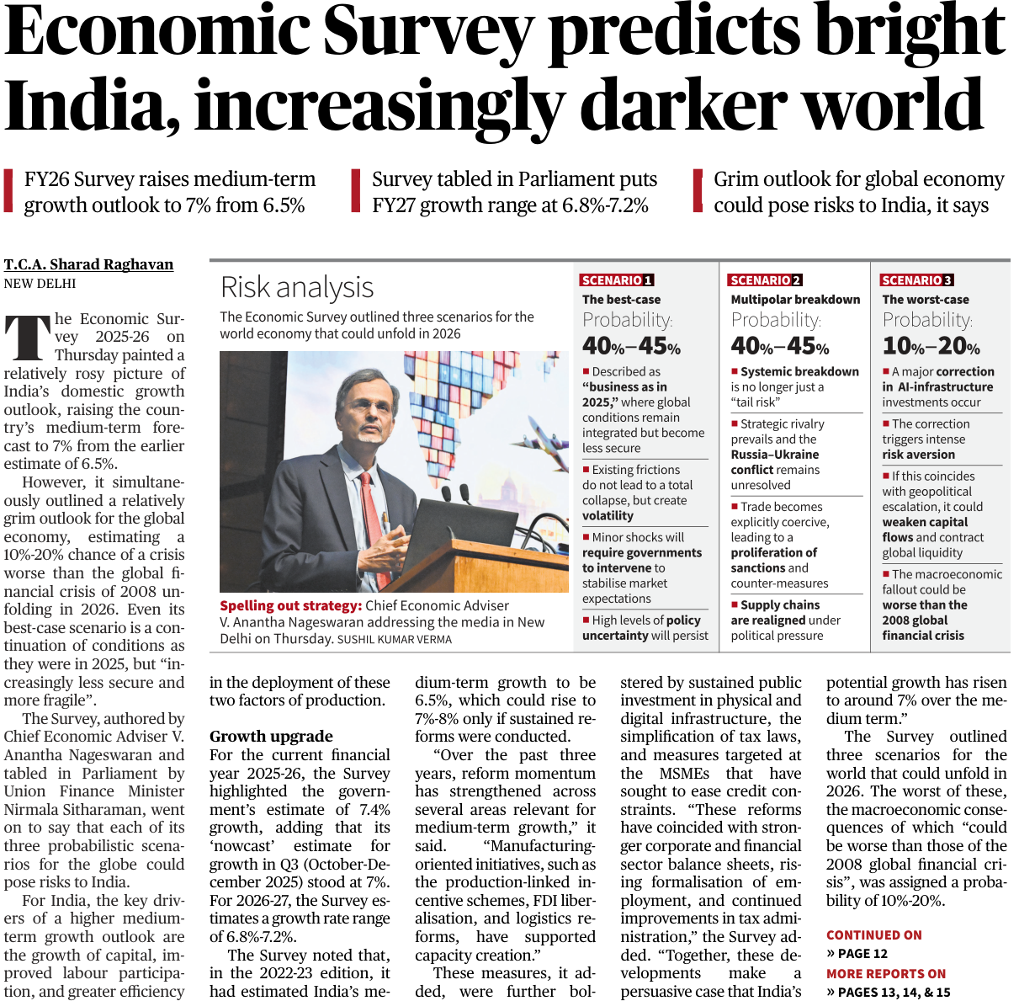
The Survey flags a grim global scenario, estimating a 10%–20% probability of a crisis worse than the 2008 global financial crisis in 2026.
Even the best-case global scenario implies higher volatility and policy uncertainty.
Global Risk Scenarios for 2026
Scenario 1: Best-case (40%–45%)
Global conditions similar to 2025 but more fragile.
Volatility persists; governments intervene to stabilise markets.
Scenario 2: Multipolar breakdown (40%–45%)
Strategic rivalries dominate global order.
Ongoing Russia–Ukraine conflict.
Proliferation of sanctions and trade coercion.
Supply chains realigned under political pressure.
Scenario 3: Worst-case (10%–20%)
Major correction in AI-related infrastructure investments.
Intense risk aversion and contraction in capital flows.
Macroeconomic fallout potentially worse than the 2008 crisis.
Implications for India
India remains relatively well-positioned due to domestic demand strength and reforms.
However, global shocks could transmit through trade, capital flows, and financial channels, posing downside risks.
Additional Information
Economic Survey
Prepared by the Chief Economic Adviser and tabled annually in Parliament ahead of the Union Budget.
Serves as a key policy document outlining macroeconomic assessment and reform priorities.
UPSC Prelims Practice Question
Q. Consider the following statements regarding the Economic Survey 2025–26:
1.It raises India’s medium-term growth outlook to 7%.
2.It rules out the possibility of a global economic crisis worse than the 2008 financial crisis.
Which of the statements given above is/are correct?
(a) 1 only
(b) 2 only
(c) Both 1 and 2
(d) Neither 1 nor 2
Correct Answer: (a)
Explanation:
Statement 1 is correct as the Survey upgrades India’s medium-term growth outlook to 7%.
Statement 2 is incorrect because the Survey estimates a 10%–20% probability of a global crisis worse than 2008.
Source: The Hindu
Health Ministry eases drug trial norms; cuts licence requirementGS 3: Science and Technology – Biotechnology, Health Regulations
Context
The Union Health and Family Welfare Ministry has notified amendments to the New Drugs and Clinical Trials (NDCT) Rules, 2019 to reduce regulatory burden and promote ease of doing business in pharmaceutical research and development.
Key Points
Regulatory Changes Introduced
Test licence requirement removed for non-commercial manufacture of small drug quantities meant for examination, research, or analysis.
Licensing has been replaced with an online prior intimation mechanism to CDSCO.
Scope and Exceptions
The relaxation does not apply to high-risk drugs, including cytotoxic drugs, narcotic drugs, and psychotropic substances.
Such categories will continue to require prior permissions.
Faster Drug Development Timeline
Reform is expected to result in a minimum saving of 90 days in the drug development life cycle.
For cases where test licences are still required, the statutory processing time reduced from 90 days to 45 days.
Impact on Clinical Research
Prior permission requirement waived for certain low-risk Bioavailability/Bioequivalence (BA/BE) studies.
These studies can now be initiated with simple online intimation to CDSCO.
Reduction in Regulatory Burden
CDSCO handles around 30,000–35,000 test licence applications annually.
The reform is expected to significantly ease compliance pressure on regulators and industry stakeholders.
Ease of Doing Business
Pharmaceutical companies can now proceed with development activities without waiting for test licences in most cases.
The move aims to boost research, innovation, and faster access to new drugs.
Central Drugs Standard Control Organization (CDSCO)
National Regulatory Authority for drugs and medical devices in India.
Functions under the Ministry of Health & Family Welfare.
Headed by the Drugs Controller General of India (DCGI).
Responsible for approval of new drugs, conduct of clinical trials, drug standards, and regulation of imported drugs.
Works in coordination with State Drug Control Organisations; jointly licenses critical drugs like vaccines, sera, blood products, and IV fluids.
UPSC Prelims Practice Question
Q. Consider the following statements regarding recent amendments to the NDCT Rules, 2019:
1.The requirement of a test licence has been removed for non-commercial manufacture of small quantities of drugs for research purposes.
2.Prior permission from CDSCO is mandatory for all Bioavailability/Bioequivalence studies.
Which of the statements given above is/are correct?
(a) 1 only
(b) 2 only
(c) Both 1 and 2
(d) Neither 1 nor 2
Correct Answer: (a)
Explanation:
Statement 1 is correct as the test licence requirement has been replaced with a prior intimation mechanism.
Statement 2 is incorrect because prior permission has been waived for certain low-risk BA/BE studies.
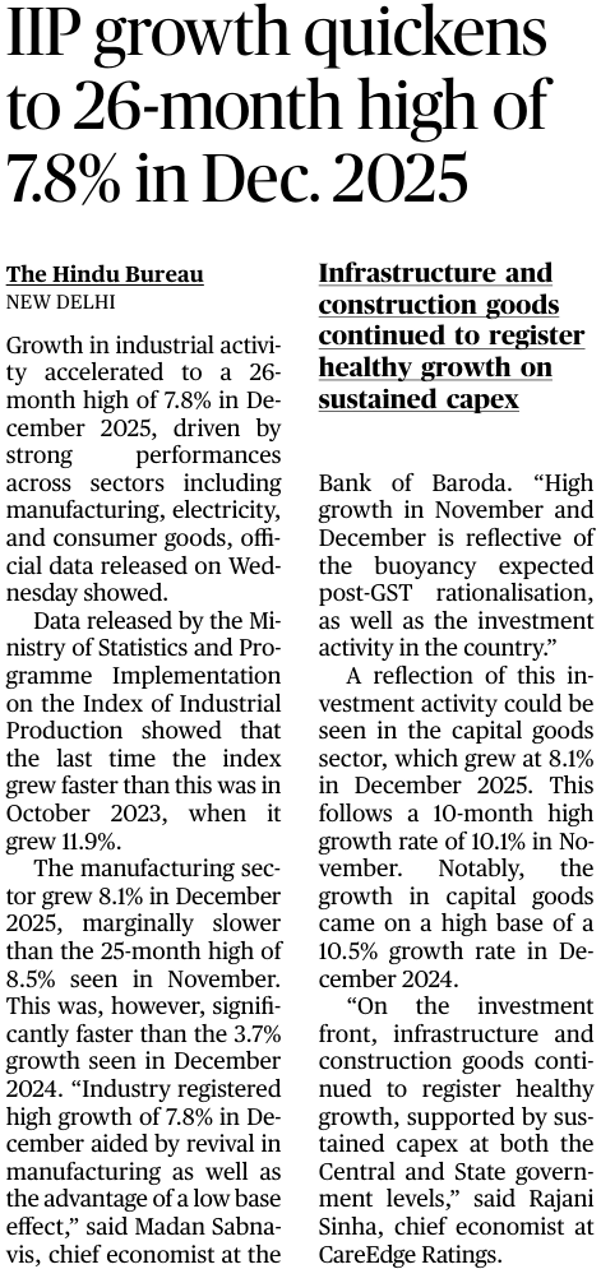
IIP growth quickens to 26-month high of 7.8% in Dec. 2025
Context
Industrial activity accelerated in December 2025, with the Index of Industrial Production (IIP) recording its fastest growth in 26 months, reflecting broad-based momentum across manufacturing, electricity, and consumer goods.
Key Points
Overall IIP Performance
IIP growth at 7.8% in December 2025, a 26-month high.
Faster than 3.7% in December 2024; aided by a low base effect.
Last higher growth was October 2023 (11.9%).
Manufacturing Sector
Manufacturing grew 8.1% in December 2025.
Slight moderation from 8.5% in November 2025, but significantly stronger than the previous year.
Indicates revival in factory output and demand.
Capital Goods and Investment
Capital goods grew 8.1% in December 2025.
Growth followed a 10-month high of 10.1% in November 2025.
Expansion came despite a high base of 10.5% in December 2024, signalling sustained investment activity.
Infrastructure and Construction
Infrastructure and construction goods recorded healthy growth, supported by sustained capex.
Public investment by Centre and States continues to drive demand for core industrial inputs.
Demand and Policy Drivers
Growth reflects post-GST rationalisation buoyancy and steady investment momentum.
Broad-based sectoral performance suggests improving industrial demand conditions.
Index of Industrial Production:
IIP measures short-term changes in the volume of industrial production in India.
Published by the Central Statistics Office (CSO) under MoSPI.
Base year: 2011–12, reflecting modern industrial structure.
Sectoral weights:
Manufacturing: 77.63%
Mining: 14.37%
Electricity: 7.99%
UPSC Prelims Practice Question
Q. With reference to the Index of Industrial Production (IIP), consider the following statements:
1.The IIP is compiled and released by the Central Statistics Office under the Ministry of Statistics and Programme Implementation.
2.Manufacturing has the highest weight in the IIP basket.
Which of the statements given above is/are correct?
(a) 1 only
(b) 2 only
(c) Both 1 and 2
(d) Neither 1 nor 2
Correct Answer: (c)
Explanation:
Statement 1 is correct as CSO under MoSPI releases the IIP.
Statement 2 is correct because manufacturing carries the highest weight (77.63%) in the IIP.
Source: The Hindu
Centre working with ‘full sensitivity’ for all communities: MurmuGS 2: Polity and Governance – Constitutional Offices, Social Justice
Context
The President of India addressed a joint sitting of Parliament, outlining the Union government’s commitment to social justice, national unity, and inclusive development amid debates on equity measures in higher education and welfare policies.
Key Points
Address to Parliament
President Droupadi Murmu addressed a joint sitting of both Houses of Parliament.
Called upon MPs to stand united on issues of national security, Viksit Bharat, and Swadeshi campaign.
Emphasis on National Unity
Quoted leaders such as Mahatma Gandhi, Jawaharlal Nehru, B.R. Ambedkar, Sardar Vallabhbhai Patel, Jayaprakash Narayan, Ram Manohar Lohia, Deendayal Upadhyaya, and Atal Bihari Vajpayee.
Highlighted that amid diverse viewpoints, the nation remains supreme.
Social Justice and Inclusion
Asserted that the Union government is working with full sensitivity for all communities.
Specific focus on Dalits, Backward Classes, marginalised sections, and tribal communities.
Addressed concerns over University Grants Commission regulations aimed at promoting equity in higher education.
Development Vision
Reiterated commitment to accelerating the reform process.
Linked reforms to the goal of achieving Viksit Bharat by 2047.
Positioned social justice as integral to sustainable and inclusive development.
Office of the President of India
The President is the constitutional head of the Indian State.
Addresses Parliament under Article 87 at the commencement of the first session each year and after general elections.
The address outlines the government’s policies, priorities, and legislative agenda.
Has health spending by the Centre increased?GS 3: Economy – Inclusive Growth, Public Finance, Social Sector (Health)
Context
Based on RBI and budget data, the article examines trends in public health spending and highlights that while States have increased health expenditure as a share of GDP, Union government health spending has declined in the post-pandemic period.
Key Points
National Health Policy Commitment
National Health Policy (2017) committed to raising government health expenditure to 2.5% of GDP by 2025.
It envisaged the Union government’s share at around 40% of total public health spending.
Current trends indicate this target is far from being achieved.
Trends in Public Health Spending
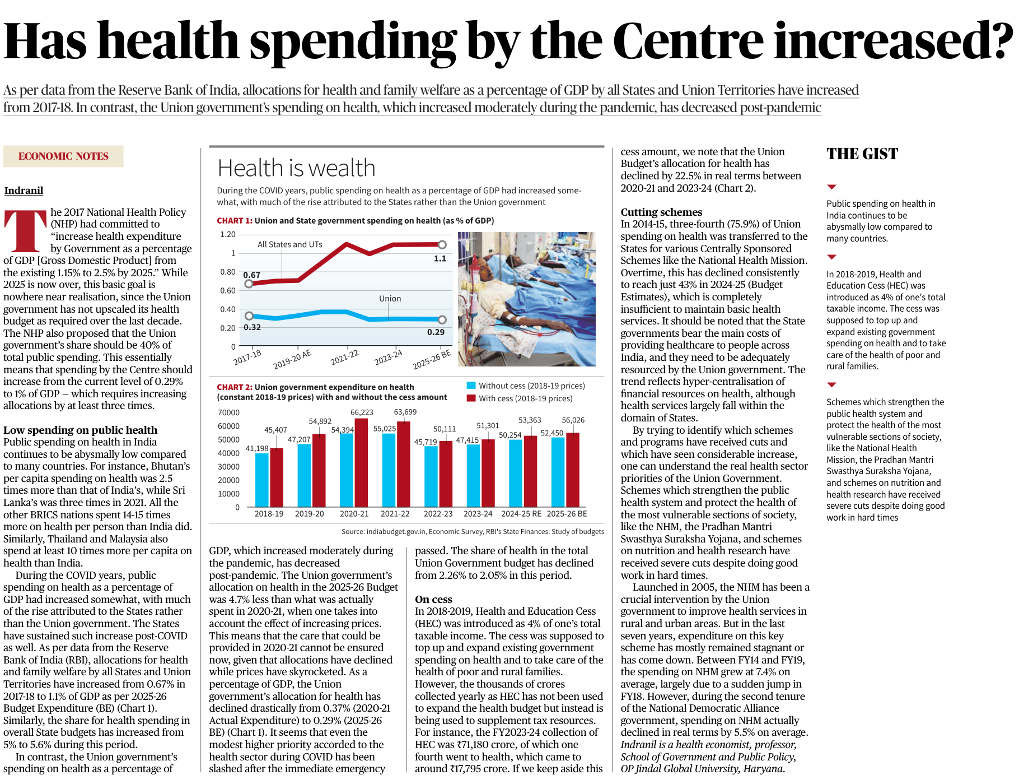
Overall public health spending in India remains low compared to many countries.
States and Union Territories increased health spending from 0.67% of GDP (2017-18) to about 1.1% (2025-26 BE).
State share in total budgets for health rose from 5% to about 5.6% during this period.
Union Government Health Expenditure
Union health spending as a share of GDP declined sharply:
From 0.37% (2020-21 Actuals) to 0.29% (2025-26 BE).
In real terms, Union Budget allocation for health declined by about 22.5% between 2020-21 and 2023-24.
The share of health in the total Union Budget fell from about 2.26% to 2.05%.
Pandemic Effect and Post-Pandemic Decline
During COVID-19, public health spending rose modestly, largely driven by States rather than the Centre.
Post-pandemic, Union allocations were reduced, even as prices increased, weakening real purchasing power.
Role of Health and Education Cess (HEC)
Introduced in 2018-19 at 4% of taxable income.
Intended to expand health spending, especially for the poor and rural populations.
However, HEC collections have largely been used to substitute general tax resources, not to expand health budgets.
Example: FY2023-24 HEC collection was about ₹71,180 crore, with only a fraction effectively adding to health spending.
Cutting of Centrally Sponsored Schemes
In 2014-15, about 75.9% of Union health spending was transferred to States.
By 2024-25 (BE), this declined to about 43%, insufficient for maintaining basic health services.
Major schemes such as National Health Mission, PM Swasthya Suraksha Yojana, and nutrition and health research programmes faced cuts despite strong performance.
Fiscal Centralisation Concern
The trend reflects per-centralisation of financial resources, even though health service delivery is primarily a State responsibility.
States bear the main burden of healthcare provision but require adequate Union support.
Ministry of Health and Family Welfare
Nodal ministry for public health policy, national health programmes, medical education, and regulation of drugs and medical devices.
Implements flagship schemes such as National Health Mission and oversees institutions for health system strengthening.
Survey raises concerns over unconditional cash transfers
GS 3: Economy – Public Finance, Fiscal Policy, Inclusive Growth
Context
The Economic Survey 2025–26, tabled in Parliament, has flagged concerns over the rapid expansion and persistence of unconditional cash transfer (UCT) schemes, especially by States, citing risks to fiscal sustainability and medium-term growth.
Key Points
What are Unconditional Cash Transfers
Direct cash payments provided to beneficiaries without mandatory conditions such as work, skill acquisition, or education outcomes.
Widely implemented by States, including women-centric schemes.
Short-term Benefits Highlighted
Provide immediate income support to poor and lower-income households.
Help meet basic consumption needs, health expenses, and debt repayment.
Have shown positive consumption effects, especially for vulnerable groups.
Rapid Expansion of Cash Transfer Schemes
Aggregate spending on UCT programmes estimated at about ₹1.7 lakh crore in FY 2025–26.
Number of States implementing such schemes increased more than five-fold between 2022–23 and 2025–26.
Around half of these schemes are estimated to be funded through revenue deficits.
Fiscal Sustainability Concerns
UCT spending estimated at 0.19–1.25% of GSDP of States.
Accounts for 0.68–8.26% of total State budgetary expenditure.
Persistent expansion without matching revenue growth raises long-term fiscal stress.
Revenue Expenditure Dominance
Revenue expenditure continues to account for the bulk of State spending, about 84% in 2023–24, compared to 86% in 2018–19.
Within revenue expenditure, there is a growing tilt towards unconditional cash transfers and committed outlays.
Trade-off with Capital Expenditure
Increased UCT spending crowds out resources for:
Physical infrastructure
Social infrastructure
Skill development and employment generation
Capital expenditure, which has stronger and more durable growth impact, becomes the first casualty during fiscal stress.
Medium-term Growth Risks
Cash transfers not backed by investments in employment, skills, and human capital may weaken medium-term growth prospects.
Risk of entrenching fiscal rigidities, as many schemes lack:
Sunset clauses
Periodic reviews
Limits States’ fiscal flexibility during economic shocks.
Political Economy Dimension
Expansion of UCT schemes has coincided with State elections, increasing fiscal pressures.
Deficits cannot be expanded indefinitely without deteriorating States’ financial health.
Economic Survey’s Core Message
Cash transfers may be justified as temporary or targeted support, but
Sustained growth requires complementing welfare with productive investments in:
Jobs
Skills
Human capital
Over-reliance on UCTs poses risks to fiscal viability and development outcomes.
Chief Economic Adviser (CEA)
Heads the preparation of the Economic Survey of India.
Advises the Government on macroeconomic policy, fiscal strategy, and growth outlook.
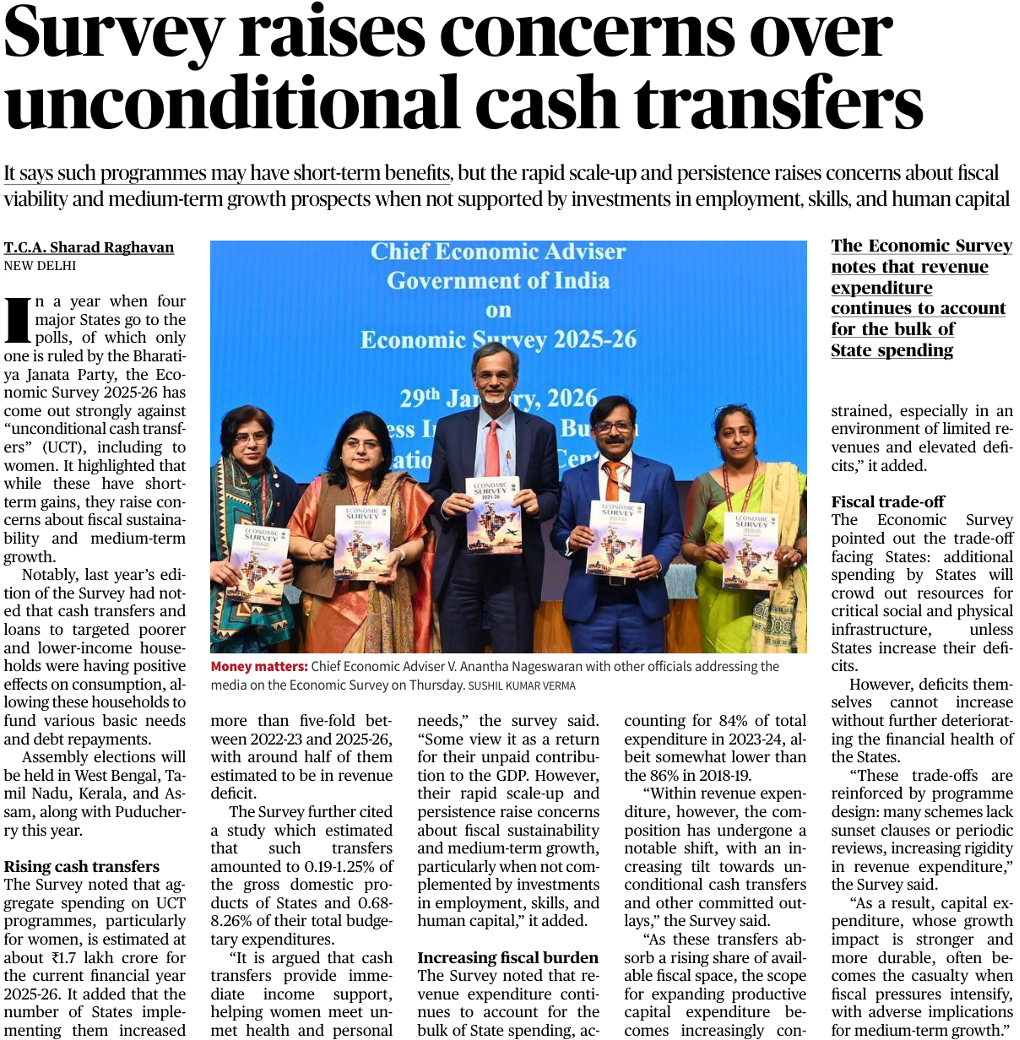
Current CEA: V. Anantha Nageswaran.
UPSC Prelims Practice Question
Q. With reference to unconditional cash transfers (UCTs) as discussed in the Economic Survey, consider the following statements:
1.Unconditional cash transfers always improve medium-term economic growth irrespective of fiscal conditions.
2.Persistent expansion of cash transfer schemes may crowd out capital expenditure by States.
Which of the statements given above is/are correct?
(a) 1 only
(b) 2 only
(c) Both 1 and 2
(d) Neither 1 nor 2
Correct Answer: (b)
Explanation:
Statement 1 is incorrect because the Economic Survey warns that UCTs can weaken medium-term growth if not supported by investments in skills and employment.
Statement 2 is correct as rising revenue expenditure on UCTs reduces fiscal space for capital expenditure.
Source: The Hindu


 Launch your Graphy